 {% hint style="info" %}
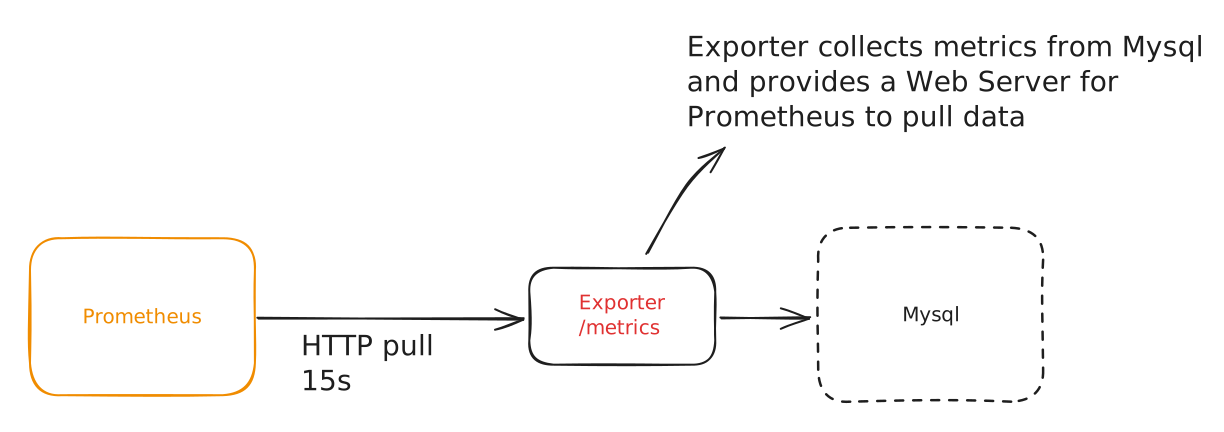
You can build your own Exporter if needed.
{% endhint %}
### [Alertmanager](https://prometheus.io/docs/alerting/latest/overview/)
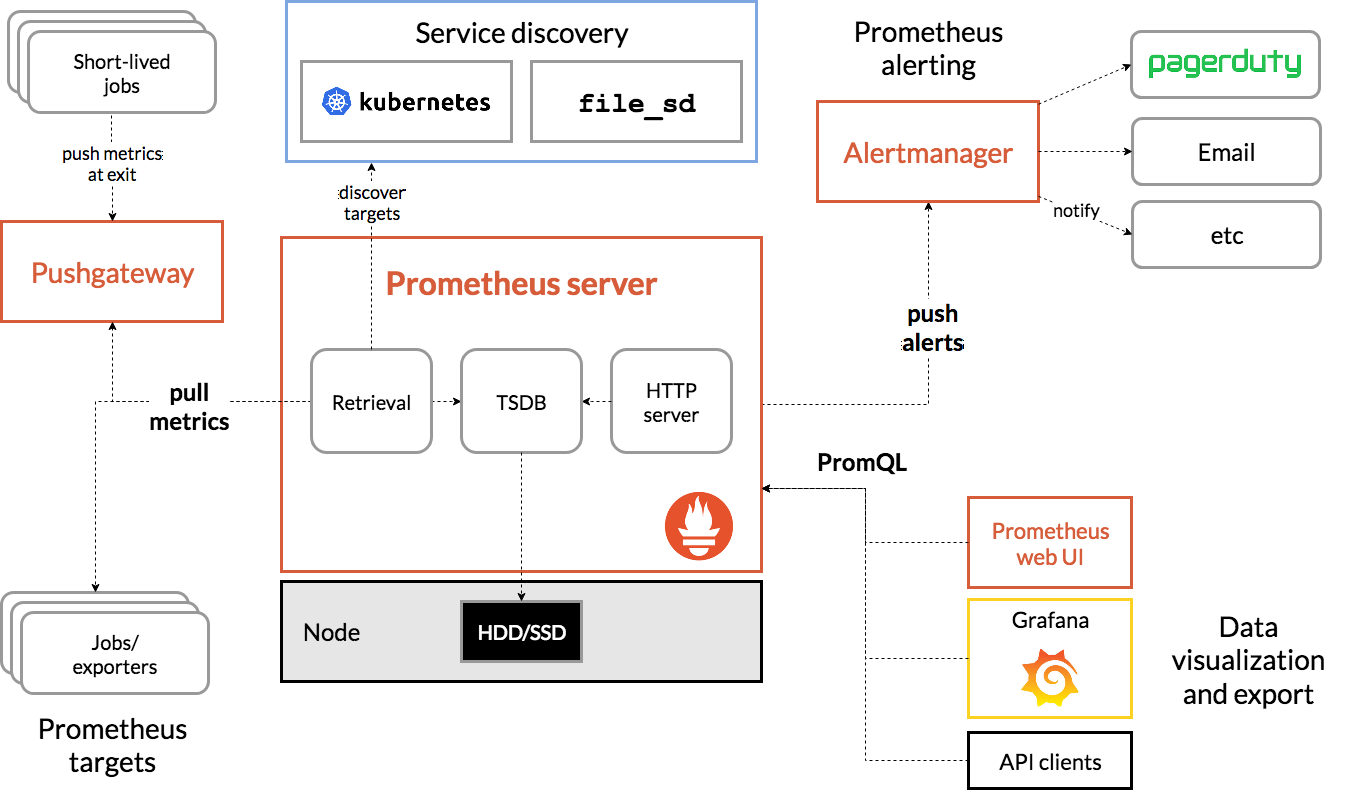
The Alertmanager hits the Prometheus Server's Http server to get the required data for the alerts to work.
## Metrics
The Prometheus client libraries offer four core metric types.
### Counter
A metric with an incremental (cumulative) value.
It can only increase or be reset to zero on restarts.
{% hint style="danger" %}
Do not use Counter to expose a value that can decrease.
*Ex.: For the number of currently running processes;*
{% endhint %}
### Gauge
It is a metric that represents a single numerical value that can arbitrarily go up and down.
*Ex.: Like mesuraments of memory usage, temperatures, etc.*
### [Histrogram](https://prometheus.io/docs/concepts/metric_types/#histogram)
A *histogram* **samples observations** (usually things like request durations or response sizes) and counts them in configurable buckets. It also provides a sum of all observed values.
Useful for **frequency distribution**.
### [Summary](https://prometheus.io/docs/concepts/metric_types/#summary)
Similar to a *histogram*, a *summary* samples observations (usually things like request durations and response sizes).
While it also provides a total count of observations and a sum of all observed values, it calculates configurable quantiles over a sliding time window.
## [PromQL](https://prometheus.io/docs/prometheus/latest/querying/basics/)
{% hint style="info" %}
The documentation is kind of weak, but Grafana for instance has really good auto complete for Prometheus queries.
{% endhint %}
{% hint style="info" %}
You can build your own Exporter if needed.
{% endhint %}
### [Alertmanager](https://prometheus.io/docs/alerting/latest/overview/)
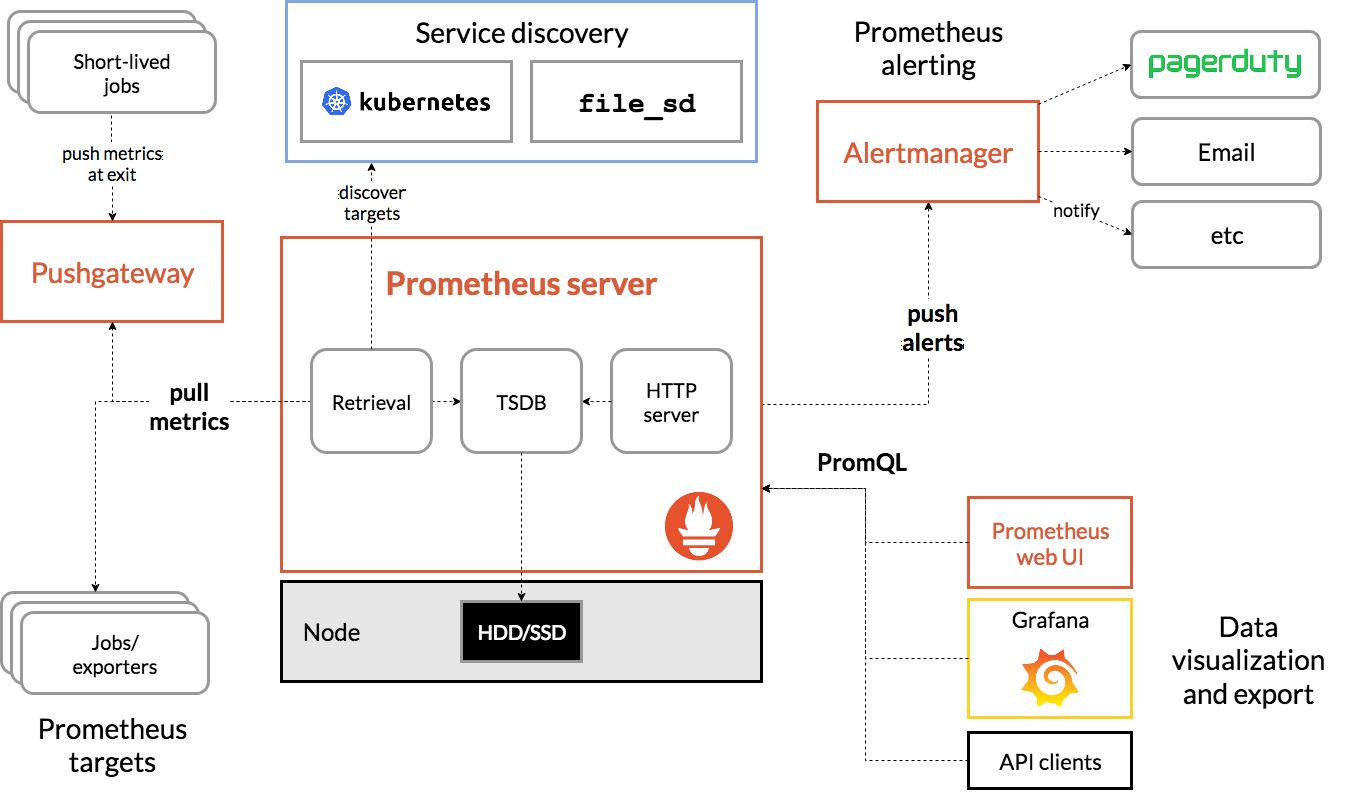
The Alertmanager hits the Prometheus Server's Http server to get the required data for the alerts to work.
## Metrics
The Prometheus client libraries offer four core metric types.
### Counter
A metric with an incremental (cumulative) value.
It can only increase or be reset to zero on restarts.
{% hint style="danger" %}
Do not use Counter to expose a value that can decrease.
*Ex.: For the number of currently running processes;*
{% endhint %}
### Gauge
It is a metric that represents a single numerical value that can arbitrarily go up and down.
*Ex.: Like mesuraments of memory usage, temperatures, etc.*
### [Histrogram](https://prometheus.io/docs/concepts/metric_types/#histogram)
A *histogram* **samples observations** (usually things like request durations or response sizes) and counts them in configurable buckets. It also provides a sum of all observed values.
Useful for **frequency distribution**.
### [Summary](https://prometheus.io/docs/concepts/metric_types/#summary)
Similar to a *histogram*, a *summary* samples observations (usually things like request durations and response sizes).
While it also provides a total count of observations and a sum of all observed values, it calculates configurable quantiles over a sliding time window.
## [PromQL](https://prometheus.io/docs/prometheus/latest/querying/basics/)
{% hint style="info" %}
The documentation is kind of weak, but Grafana for instance has really good auto complete for Prometheus queries.
{% endhint %}